|
|
|
|
|
|
|
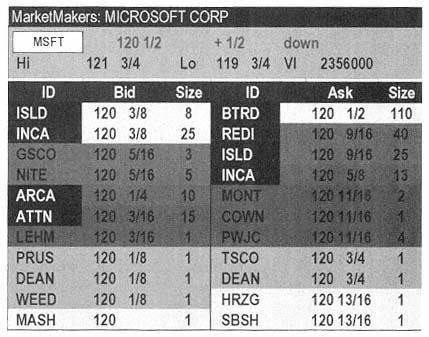
This window shows a great deal of information about INTC (Intel). The MMID column shows the four-letter identifier for each of the various market makers or ECNs. Again, we see the inside market. The price levels will be identified by different colors, and we can see the size (in hundreds of shares) of the various bids and offers. |
|
|
|
|
|
|
|
|
You can instantly see the strength of interest at a particular price by the number of market makers and ECNs, and by the posted share size. Remember that earlier we talked about size and the fact that while the market makers disguise the real size of their interest, the ECNs tend to disclose the true size of their interest. |
|
|
|
|
|
|
|
|
Level II is so COOL. What you are really seeing as you watch the level II screen is prices responding to supply and demand, in real-time action. |
|
|
|
|
|
|
|
|
Figure 11.3 shows a snapshot of a stock. |
|
|
|
|
|
|
|
|
What does this snapshot tell you about the market? Not much, because you have no frame of reference. You learn what a stock is doing by watching the movement on this level II screen. |
|
|
|
|
|
|
|
|
Figure 11.3
Snapshot of MSFT at 11:00 AM |
|
|
|
|
|